Copy number variants (CNVs) are unbalanced genomic rearrangements larger than 50 base pairs, extending up to several megabases; smaller variations are called insertions or deletions (indels) (1). Because read depth scales with the number of allele copies present, a copy-number change registers as a shift in sequencing coverage. This lets CNVs be called from the same next-generation sequencing (NGS) data used to identify single-nucleotide variants (SNVs), and reported through the same diagnostic workflow (Figure 1).
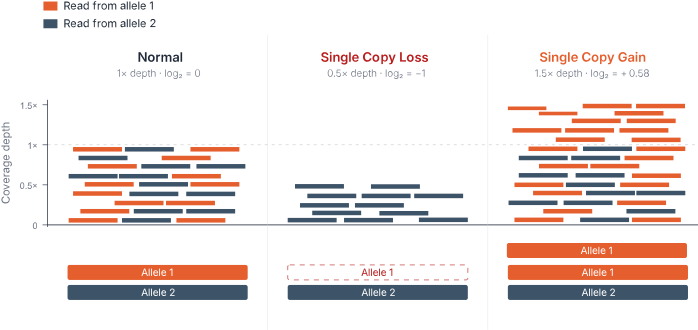
Figure 1. Read depth scales directly with the number of allele copies present.
The Technical Factors Behind a Reliable Call
Identifying CNVs from NGS data is more difficult than it is for SNVs or indels, and it demands careful attention at multiple stages. SNV detection is largely a per-base question: does the read match the reference at this position? CNV detection, by contrast, is a process that depends on sequencing depth, cohort composition, and even the CNV size that is being queried (2, 3). None of these relate to the patient’s biology, yet all shape which CNVs are detected.
CNV detection algorithms compare read depth against a baseline established from a pool of samples processed under the same technical conditions. This pool serves two purposes: it defines the baseline for detecting deviations, and it is used to normalize away the technical biases introduced during sample preparation, sequencing, and data processing; biases that would otherwise reduce both sensitivity and specificity (3, 4). The composition of the reference pool matters most when the cohort is small, because each sample then makes up a larger share of the baseline. In a large cohort, a CNV-carrying sample barely shifts the baseline and a real variant still stands out clearly. However, in a small cohort, one or two carriers can shift the baseline until the variant no longer stands out, leaving it undetected (4).
Before a variant can be classified, filtered against population databases, or matched to a disease, it has to clear a more basic check: is the call itself real, or an artifact? NGS pipelines can detect CNVs with high sensitivity under optimal conditions, but those conditions are not always available (2, 3, 5). Confirming the call comes first.
How SEQ Platform Handles Technical Confidence
SEQ Platform’s CNV analysis runs on the optimized GATK gCNV pipeline (3). A second caller, Delly, uses a split-read method to improve deletion sensitivity in exome kits and larger gene panels (6). Around these tools, SEQ Platform adds the structure: kit consistency, cohort composition, incidence filtering, visible cohort context, and in-platform visual review. This structure puts the technical context in front of the analyst, who then judges whether the call is real enough enough to interpret. Only then is it worth asking the next question: is it rare?
The Resources Behind a Frequency Call
Rarity is the first filter in CNV interpretation, and establishing it means consulting resources built for different purposes, each with limitations. Two population-level resources form the backbone of CNV frequency assessment. The Database of Genomic Variants (DGV) catalogs structural variants identified in healthy individuals across multiple published studies (7). NCBI’s Database of Genomic Structural Variation (dbVar) is the primary repository for submitted structural variation records, including raw data not yet incorporated into DGV (8). Both are widely used to tell rare CNVs from common ones. The main limitation of both sources is heterogeneity. They pool data from studies with different detection methods, resolution thresholds, and breakpoint precision, so entries are not directly comparable.
The Genome Aggregation Database (gnomAD) addresses some of these limitations through standardized variant calling across a large population sample (9). Alongside genome-wide allele frequencies, it provides two gene-level constraint scores worth knowing: pLI and LOEUF.
All three resources share one further limitation: population coverage. gnomAD, despite its scale, remains skewed toward individuals of European ancestry (9). For a patient from an underrepresented population, a CNV can appear rare simply because that population is thinly represented in the reference, not because the variant is genuinely uncommon.
How SEQ Platform Handles Frequency Data
Even with these resources all consulted, two gaps remain: the data lives in separate tools, and none of it captures local population variation. SEQ Platform closes both.
One view instead of many tabs. SEQ Platform pulls allele frequencies and constraint scores into a single CNV results view, so the analyst is not switching between browser tabs to assemble a rarity picture for each call:
- The Frequency tab shows allele frequency, allele count, and reciprocal overlap from gnomAD SV, dbVar, and DGV Gold for each detected CNV, and presents them at the point of interpretation.
- The Constraint column displays pLI and LOEUF from gnomAD next to each affected gene, making it immediately clear when a low-frequency CNV also lands on a dosage-sensitive locus.
A local frequency layer the public databases can’t provide. SEQ Platform adds a center-specific CNV database built from the lab’s own accumulated patient data, processed on the same platform under the same conditions. This captures population-specific variation that public resources miss, and acts as a real-time filter: a CNV that recurs across multiple unrelated patients in the same center is more likely to be a local population polymorphism than a pathogenic finding (Figure 2). Beyond the lab’s own records, the analyst can also query an aggregated database spanning the wider Genomize network, adding a regional, population-level frequency signal that a single center could not build alone. Neither replaces DGV or gnomAD; together they complement the public resources with local and regional context.

Figure 2. Interpreting a CNV’s rarity requires reading global and local frequency together..
SEQ Platform shows this internal layer in two ways.
- The Occurrence within Cohort column shows, for each CNV in the current cohort, how many samples in the run carry a deletion, duplication, mixed, or wild-type state at that position, a real-time filter for run-wide artifacts and shared local polymorphisms.
- The Overlapping CNVs column extends this across the accumulated history, both the lab’s own prior analyses and the wider Genomize network, scoring each call against every relevant past analysis. Reciprocal overlap and cohort filters are configurable per site or per session.
The payoff: a CNV seen in five unrelated patients from the same lab but absent from gnomAD and DGV is far more likely to be regional variation or a lab-specific calling artifact than a disease-causing event, a use of internal frequency catalogs well established in clinical sequencing practice (12). The analyst sees that context the moment they interpret the call, not after a separate cross-reference.
The Evidence Behind a Pathogenicity Call
Quality and frequency are gatekeeping layers that narrow the field to variants worth a closer look; establishing clinical significance takes a different class of evidence: curated data linking a dosage change to a phenotype. CNVs resolve rare-disease cases that SNV analysis alone leaves unsolved (13), and that evidence comes from several complementary resources.
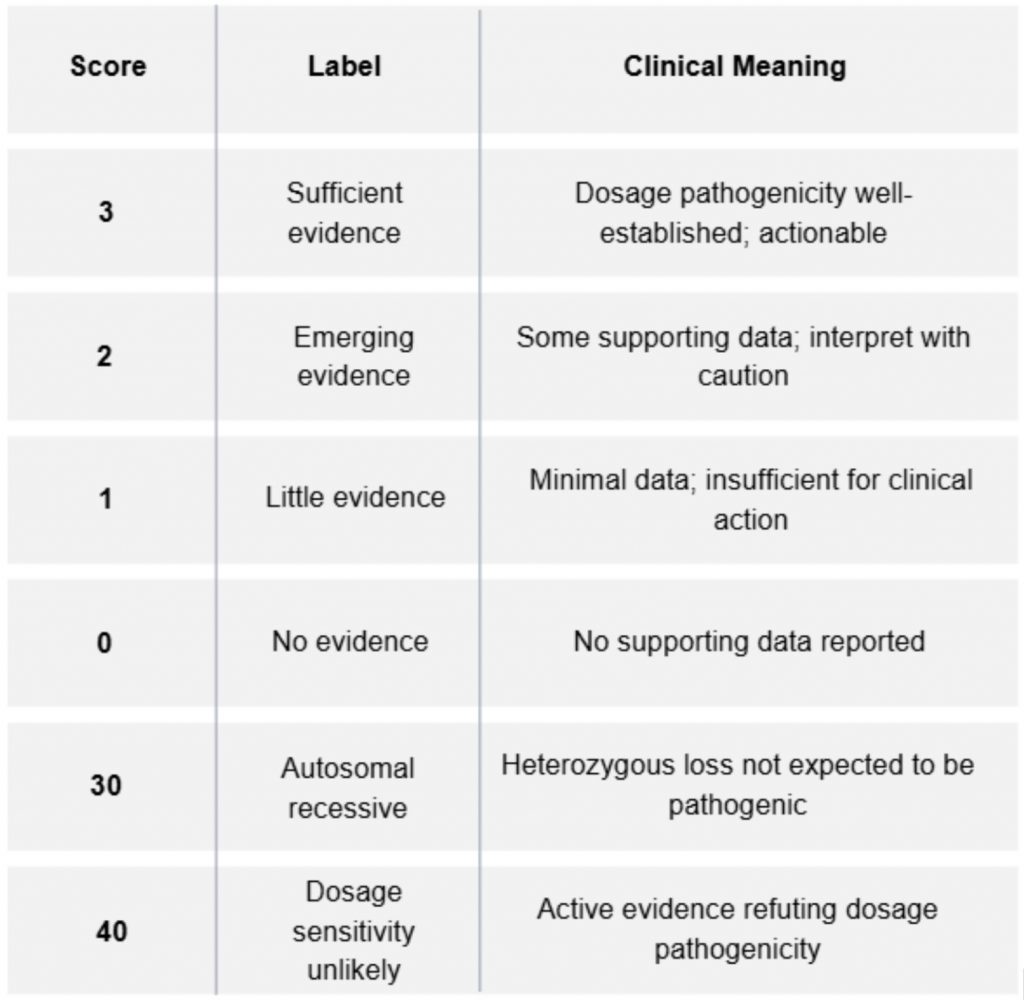
ClinGen Dosage Sensitivity provides the most direct gene-level evidence. For each gene or genomic region, ClinGen expert panels assign a haploinsufficiency (HI) score, reflecting the evidence that losing one copy causes disease, and a triplosensitivity (TS) score reflecting the evidence that gaining one copy causes disease【E】. These ratings are derived from curated clinical cases, functional studies, and inheritance data. A CNV affecting a gene with an HI score of 3 carries fundamentally different clinical weight than one scoring 0, even if both are equally rare in gnomAD (14).
Table 1. ClinGen score interpretation.
ClinVar is a public database of variant-level pathogenicity assertions. Its CNV coverage is less comprehensive than for SNVs: entries are fewer and less consistently annotated. Unlike SNVs, CNVs have variable breakpoints, meaning two entries describing the same deletion may use different genomic boundaries. Reciprocal overlap between the query CNV and ClinVar entries therefore becomes a critical parameter: a 10% overlap with a pathogenic entry carries far less interpretive weight than an 80% overlap (15).
DECIPHER approaches pathogenicity from the case side. Hosted by EMBL-EBI, it links candidate diagnostic variants to phenotypes across tens of thousands of rare-disease patients deposited by clinical centers worldwide (16). For CNV interpretation it lets clinicians ask whether a variant has been seen before in patients with a similar presentation, which is invaluable for cases needing deeper phenotypic work.
The framework that ties these together is the ACMG/ClinGen technical standards for CNV interpretation (17): a scoring system that weighs dosage sensitivity, population frequency, gene content, and overlap with established pathogenic regions into five tiers: pathogenic (P), likely pathogenic (LP), variant of uncertain significance (VUS), likely benign (LB), or benign (B). They are the CNV counterparts of the Richards 2015 sequence-variant guidelines (18).
How SEQ Platform Handles Pathogenicity Evidence
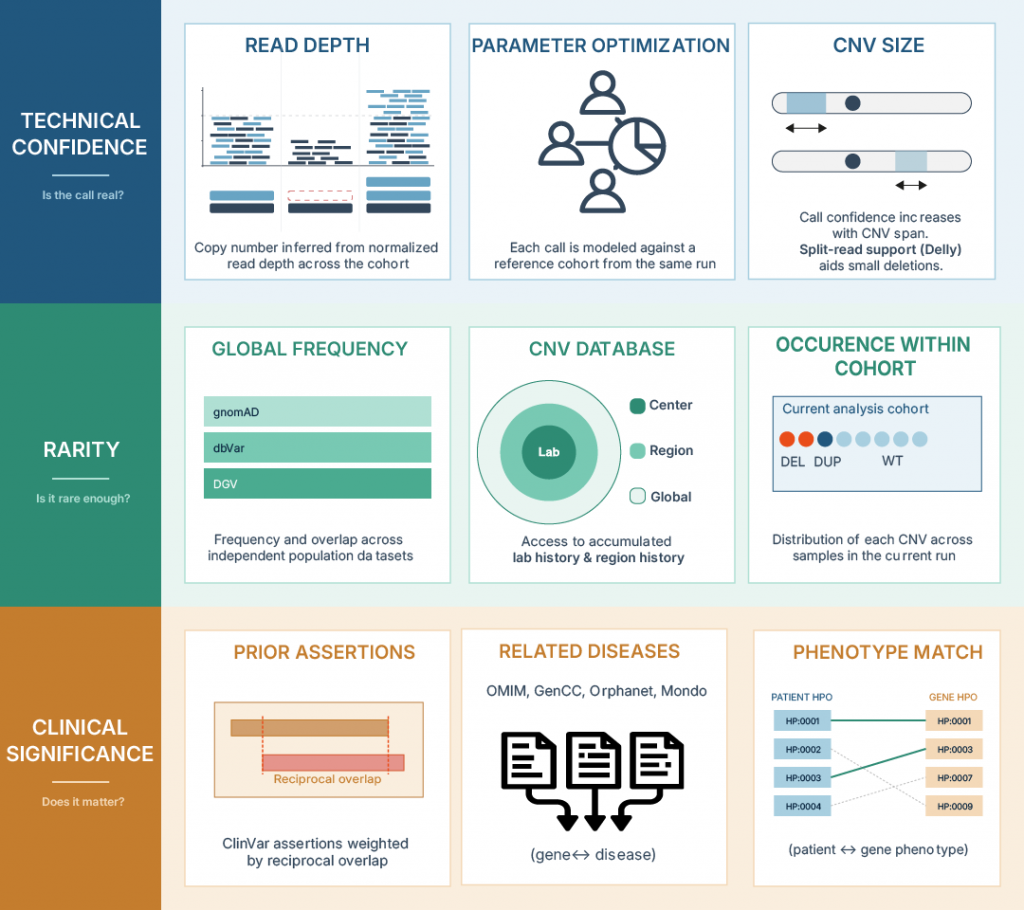
Figure 3. Three-layer framework for CNV interpretation. Each layer asks a distinct question and draws on its own evidence sources, integrated across the SEQ Platform analysis view.
SEQ Platform supports an uninterrupted analysis by integrating all this information from several resources into a single view.
When the region of interest has been classified before, three resources show that in parallel locations on the page. The ClinVar tab shows ClinVar entries that intersect the detected CNV, with clinical significance, reciprocal overlap, and related diseases. The Dosage column displays HI and TS scores per affected gene or genomic region, pulled from ClinGen. The ClinGen Dosage Sensitivity Region tab lists entries for any recurrent syndromic region the CNV overlaps.
When the variant has not been classified previously, the analyst can move directly to other lines of evidence on the same page. SEQ Platform flags whether the CNV interrupts the Open Reading Frame (ORF) of any transcript in the region. The Transcript view shows per-exon copy-number state graphically, so it is clear which exons fall inside the call. The Related Diseases column lists the diseases associated with each affected gene from curated databases (OMIM, GenCC, Orphanet, Mondo) , along with mode of inheritance. The HPOs column contains counts of Human Phenotype Ontology (HPO)-term matches against the clinical information entered at sample upload, or applied through phenotype filters. Together, these columns let the analyst judge whether the affected region matches the patient’s phenotype.
ACMG/ClinGen 2020 CNV pathogenicity is calculated automatically and displayed in the ACMG column, with each assigned evidence code and the total score that drives the final classification. Because automated classifications cannot always reflect the most recent literature or case-specific judgment, the My Verdict column lets the analyst override the predicted classification. The verdict is bound to the CNV itself, so when the same variant appears in another sample on the platform, the previous call is shown alongside the new analysis. Over time, this builds a lab-internal classification history.
The three-layer framework discussed throughout this article (Figure 3) reflects how clinical CNV interpretation works in practice: confirm the call, establish rarity, then weigh disease evidence. SEQ Platform brings each into a single environment, with technical context, frequency, and ACMG/ClinGen evidence side by side. The analyst can then spend their judgment on the variant itself, rather than on gathering the evidence needed to judge it.
References
1. Zarrei M, MacDonald JR, Merico D, Scherer SW. A copy number variation map of the human genome. Nat Rev Genet. 2015;16(3):172–83. doi:10.1038/nrg3871.
2. Aslan, T. (2021, February 28). The effects of sequencing depth and cohort size on NGS CNV analysis [White paper]. Genomize. https://genomize.com/the-effects-of-sequencing-depth-and-cohort-size-on-cnv-analysis/
3. Babadi M, Fu JM, Lee SK, et al. GATK-gCNV enables the discovery of rare copy number variants from exome sequencing data. Nat Genet. 2023;55(9):1589–97. doi:10.1038/s41588-023-01449-0.
4. Plagnol V, Curtis J, Epstein M, et al. A robust model for read count data in exome sequencing experiments and implications for copy number variant calling. Bioinformatics. 2012;28(21):2747–2754. doi: 10.1093/bioinformatics/bts526.
5. Minoche AE, Lundie B, Peters GB, et al. ClinSV: clinical grade structural and copy number variant detection from whole genome sequencing data. Genome Med. 2021;13(1):32. doi:10.1186/s13073-021-00841-x.
6. Rausch T, Zichner T, Schlattl A, Stütz AM, Benes V, Korbel JO. DELLY: structural variant discovery by integrated paired-end and split-read analysis. Bioinformatics. 2012;28(18):i333–9. doi:10.1093/bioinformatics/bts378.
7. MacDonald JR, Ziman R, Yuen RK, Feuk L, Scherer SW. The Database of Genomic Variants: a curated collection of structural variation in the human genome. Nucleic Acids Res. 2014;42(Database issue):D986–92. doi:10.1093/nar/gkt958
8. Lappalainen I, Lopez J, Skipper L, Hefferon T, Spalding JD, Garner J, et al. DbVar and DGVa: public archives for genomic structural variation. Nucleic Acids Res. 2013;41(D1):D936–41. doi:10.1093/nar/gks1213
9. Collins RL, Brand H, Karczewski KJ, Zhao X, Alföldi J, Francioli LC, et al. A structural variation reference for medical and population genetics. Nature. 2020;581(7809):444–51. doi:10.1038/s41586-020-2287-8
10. National Center for Biotechnology Information (NCBI). NCBI Curated Common Structural Variants (nstd186). dbVar. Bethesda (MD): U.S. National Library of Medicine. Available from: https://www.ncbi.nlm.nih.gov/dbvar/studies/nstd186/ [accessed 2026 Jun 11]
11. Karczewski KJ, Francioli LC, Tiao G, Cummings BB, Alföldi J, Wang Q, et al. The mutational constraint spectrum quantified from variation in 141,456 humans. Nature. 2020;581(7809):434–43. doi:10.1038/s41586-020-2308-7
12. Gross AM, Ajay SS, Rajan V, Brown C, Bluske K, Burns NJ, et al. Copy-number variants in clinical genome sequencing: deployment and interpretation for rare and undiagnosed disease. Genet Med. 2019;21(5):1121–30. doi:10.1038/s41436-018-0295-y
13. Atik T, Avci Durmusalioglu E, Isik E, Kose M, Kanmaz S, Aykut A, Durmaz A, Ozkinay F, Cogulu O. Diagnostic yield of exome sequencing-based copy number variation analysis in Mendelian disorders: a clinical application. BMC Med Genomics. 2024;17(1):239. doi:10.1186/s12920-024-02015-1
14. Riggs ER, Church DM, Hanson K, Horner VL, Kaminsky EB, Kuhn RM, et al. Towards an evidence-based process for the clinical interpretation of copy number variation. Clin Genet. 2012;81(5):403–12. doi:10.1111/j.1399-0004.2011.01818.x
15. Landrum MJ, Lee JM, Benson M, Brown GR, Chao C, Chitipiralla S, et al. ClinVar: improving access to variant interpretations and supporting evidence. Nucleic Acids Res. 2018;46(D1):D1062–7. doi:10.1093/nar/gkx1153
16. Foreman J, Brent S, Perrett D, Bevan AP, Hunt SE, Cunningham F, Hurles ME, Firth HV. DECIPHER: Supporting the interpretation and sharing of rare disease phenotype-linked variant data to advance diagnosis and research. Hum Mutat. 2022;43(6):682–697. doi:10.1002/humu.24340
17. Riggs ER, Andersen EF, Cherry AM, Kantarci S, Kearney H, Patel A, et al. Technical standards for the interpretation and reporting of constitutional copy-number variants: a joint consensus recommendation of the American College of Medical Genetics and Genomics (ACMG) and the Clinical Genome Resource (ClinGen). Genet Med. 2020;22(2):245–57. doi:10.1038/s41436-019-0686-8
18. Richards S, Aziz N, Bale S, Bick D, Das S, Gastier-Foster J, et al. Standards and guidelines for the interpretation of sequence variants: a joint consensus recommendation of the American College of Medical Genetics and Genomics and the Association for Molecular Pathology. Genet Med. 2015;17(5):405–24. doi:10.1038/gim.2015.30