Copy number variations (CNVs) are unbalanced genomic rearrangements larger than 50 base pairs, extending up to several megabases; smaller variations are called insertions or deletions (indels) (1). Because read depth scales with the number of allele copies present, they are detected from the same next-generation sequencing (NGS) data used to identify single-nucleotide variants (SNVs), and are reported through the same diagnostic workflows (Figure 1).
Identifying CNVs from NGS data is more difficult than it is for SNVs or indels, and it demands careful attention at multiple stages of the workflow. SNV detection is largely a per-base question: does the read match the reference at this position? CNV detection, by contrast, is a process that depends on sequencing depth, cohort composition, and even the CNV size that is being queried (2, 3). None of these factors relate to the patient’s biology, yet all of them shape which CNVs are detected and which are not.
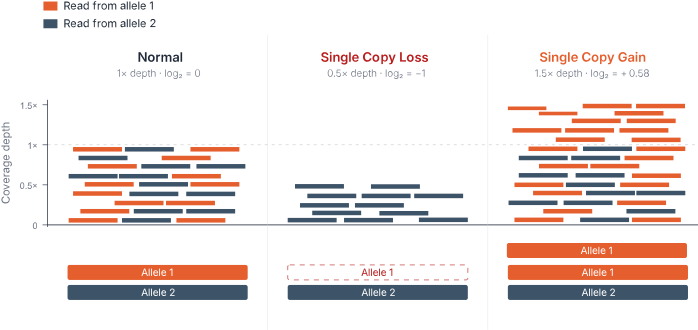
Figure 1. Read depth scales directly with the number of allele copies present.
CNV detection algorithms compare read depth against a baseline established from a pool of samples processed under the same technical conditions. This pool serves two purposes: it defines the baseline for detecting deviations, and it is used to normalize away the technical biases introduced during sample preparation, sequencing, and data processing; biases that would otherwise reduce both sensitivity and specificity (3, 4). The composition of the reference pool matters most when the cohort is small, because each sample then makes up a larger share of the baseline. In a large cohort, a CNV-carrying sample barely shifts the baseline and a real variant still stands out clearly against it. However, in a small cohort, one or two carriers can shift the baseline until the variant no longer stands out, leaving it undetected (4).
Before a variant can be classified, filtered against population databases, or matched to a disease, it has to clear a more basic check: is the call itself real, or an artifact? NGS pipelines can detect CNVs with high sensitivity under optimal conditions, but those conditions are not always available (2, 3, 5). This article is about what it takes to know whether a given call is one you can trust.
How SEQ Platform handles technical confidence
SEQ Platform‘s CNV analysis runs on the optimized GATK gCNV pipeline (3). A second caller, Delly, uses a split-read method to improve deletion sensitivity in exome kits and larger gene panels (6). Around these tools, SEQ Platform adds a set of checks that make the “is this call real” question easier to answer before the point of interpretation.
The validation study. In a benchmark that compared SEQ Platform CNV calls against orthogonal MLPA results, sensitivity ranged from 95.46% under best-case conditions (96-sample cohort at 600X) down to 42.42% under less favorable conditions (8-sample cohort at 60X) (2). Specificity, however, remains above 99.6% across all depth and cohort scenarios.
Sample eligibility and cohort makeup. SEQ Platform requires a minimum of eight samples before a CNV analysis can start so that no individual sample weighs heavily enough to distort the cohort baseline. Eight is a floor rather than an optimum, as the cohort grows, detection becomes more sensitive (2). Samples must come from the same sequencing run and be prepared with the same library kits so that they share the same technical conditions, minimizing variability. If the sex chromosomes are being evaluated, all samples in a single analysis must be of the same sex. Samples should also be unrelated in small cohorts to prevent creating a baseline biased toward the CNV that the family may carry. Having a few relatives in a large cohort usually does not pose this problem. A rare pathogenic CNV in one patient is very unlikely to be shared by unrelated individuals, so it stays absent from the baseline they define and the CNV remains detectable. Together, these keep the analysis reliable even in smaller cohorts.
Cohort-level artifacts are filtered before they reach the analyst. Any CNV that appears in more than half of the cohort (or whichever threshold the user sets) is filtered out. A CNV present in most samples of an unrelated cohort is almost always a capture or alignment artifact, not biology. The threshold is adjustable per analysis, and can be turned off when the analyst wants to see every call regardless of recurrence.
Cohort context is displayed on every call. For each variant, the CNV table shows how many samples in the cohort carry a deletion, duplication, mixed state, or wild type at that region. A call that appears in one sample out of twenty looks different from one that appears in six, and the analyst sees that context at the point of interpretation, not as a separate quality control step. The detailed view extends this with a per-sample plot of the CNV across the cohort.
Visual verification happens on the platform. Read-depth-based callers are sensitive to sequencing noise and capture bias, and visual review of coverage is a routine check for distinguishing real copy number changes from technical artifacts. SEQ supports this directly in the analysis view: It plots log2 copy number ratios for each call and an integrated IGV view lets the analyst inspect the underlying reads at specific coordinates or intervals. Analysts can use these tools without exporting BAM files to an external viewer. The visual check happens at the point of interpretation, not in a separate session.
None of this changes what the underlying caller can detect at a given depth. The validation study above is the ceiling: it shows what GATK gCNV can do with high-quality input. What SEQ Platform adds is the structure around the caller: kit consistency, cohort composition, incidence filtering, visible cohort context, and in-platform visual review. This structure gives the analyst a defensible answer to the question the rest of the workflow depends on: is this call real enough to interpret? Only then is it worth asking the next question: is it rare?
References
1. Zarrei M, MacDonald JR, Merico D, Scherer SW. A copy number variation map of the human genome. Nat Rev Genet. 2015;16(3):172–83. doi:10.1038/nrg3871.
2. Aslan, T. (2021, February 28). The effects of sequencing depth and cohort size on NGS CNV analysis [White paper]. Genomize. https://genomize.com/the-effects-of-sequencing-depth-and-cohort-size-on-cnv-analysis/
3. Babadi M, Fu JM, Lee SK, et al. GATK-gCNV enables the discovery of rare copy number variants from exome sequencing data. Nat Genet. 2023;55(9):1589–97. doi:10.1038/s41588-023-01449-0.
4. Plagnol V, Curtis J, Epstein M, et al. A robust model for read count data in exome sequencing experiments and implications for copy number variant calling. Bioinformatics. 2012;28(21):2747–2754. doi: 10.1093/bioinformatics/bts526.
5. Minoche AE, Lundie B, Peters GB, et al. ClinSV: clinical grade structural and copy number variant detection from whole genome sequencing data. Genome Med. 2021;13(1):32. doi:10.1186/s13073-021-00841-x.
6. Rausch T, Zichner T, Schlattl A, Stütz AM, Benes V, Korbel JO. DELLY: structural variant discovery by integrated paired-end and split-read analysis. Bioinformatics. 2012;28(18):i333–9. doi:10.1093/bioinformatics/bts378.